
February Market Update: Rotation, Resilience, and Rising Geopolitical Risk
February 2026 was a month defined by rotation and divergence across global markets. U.S. large-cap equities posted modest declines as investors navigated persistent inflation questions, mixed economic data, and a pullback in technology and growth-oriented stocks. The S&P 500 declined roughly -0.9% for the month, while the technology-heavy NASDAQ Composite fell closer to -3.4%. The Dow Jones Industrial Average held up better and finished the month roughly flat, while the Russell 2000 gave back a portion of January’s strong rally.
Economic data during the month sent mixed signals. The advance estimate of fourth quarter 2025 GDP showed growth slowing to a 1.4% annualized pace, reflecting the lingering effects of the fall government shutdown and a moderation in consumer activity. Inflation data also told a two-sided story. January CPI came in cooler than expected at 2.4% year over year, suggesting continued progress toward the Federal Reserve’s inflation target. However, a hotter-than-expected Producer Price Index release later in the month reminded investors that inflation pressures have not fully disappeared.
International markets continued to outperform U.S. benchmarks as investors rotated toward regions where valuations remain more attractive and economic data has shown incremental improvement. At the same time, geopolitical tensions escalated in the Middle East as the conflict involving the United States, Israel, and Iran escalated. The situation has increased uncertainty in global energy markets and contributed to a renewed bid for traditional safe-haven assets such as gold. So far, the economic impact has been limited, but developments in the region remain an important factor shaping investor sentiment.
U.S. Equity Market Review
One of the most notable features of February was the continued rotation away from mega-cap growth stocks toward value and cyclical sectors. The S&P 500 Equal Weight Index significantly outperformed the traditional capitalization-weighted index, highlighting the gradual broadening of market participation beyond the largest technology companies.
Small- and mid-cap stocks experienced some volatility during the month but remain among the stronger performers year to date. Meanwhile, the CBOE Volatility Index moved closer to 30 by early March, reflecting elevated investor uncertainty following the surprise inflation data and rising geopolitical tensions.
Major Index Performance – February 2026
| Index | Month Close | YTD Return |
| S&P 500 | 6,878 | +0.49% |
| Dow Jones Industrial Average | 48,977 | +1.90% |
| NASDAQ Composite | 22,668 | -2.47% |
| Russell 2000 | 2,632 | +4.95% |
Source: YCharts
Global Markets, Commodities, and Geopolitical Risk
International equity markets continued to outperform the United States in February, extending one of the most notable trends of early 2026. The MSCI World ex-U.S. Index has gained meaningfully year to date, compared with a relatively flat return for the S&P 500.
European markets were particularly strong. The Stoxx Europe 600 reached new highs during the month as improving economic data and rising earnings expectations attracted investor capital. Germany’s DAX and the United Kingdom’s FTSE 100 also traded near record levels. Positive PMI data across the eurozone pointed to the fastest improvement in new orders in several years, suggesting the region’s manufacturing slowdown may be stabilizing.
Asian markets also contributed to global gains. Japan’s Nikkei 225 reached new highs during the month before moderating slightly toward the end of February. Emerging markets advanced as well, supported by a weaker U.S. dollar, strong technology investment across parts of Asia, and ongoing central bank purchases of gold.
Commodity markets reflected both economic and geopolitical forces. Oil prices fluctuated throughout the month as investors balanced steady global demand with uncertainty surrounding Middle East tensions and OPEC+ policy decisions. Disruption to energy infrastructure and shipping routes in the region are beginning to have meaningful implications for global supply, which is why markets tend to react quickly to developments in the conflict.
Precious metals continued their rally, supported by central bank demand and the increasing role of gold as a geopolitical hedge. When uncertainty rises, investors often seek assets that historically preserve value during periods of instability.
International Equity Performance – February 2026
| Index | Month Close | YTD Return |
| MSCI EAFE | 3179.91 | +9.93% |
| MSCI Emerging Markets | 1610.70 | +14.69% |
| MSCI World | 278.75 | +2.85% |
| MSCI Frontier Markets | 802.20 | +6.34% |
Source: YCharts
Economic Conditions, Inflation, and Federal Reserve Policy
The U.S. economy continued to grow in early 2026, though at a slower pace than the second half of last year. The Bureau of Economic Analysis reported that real GDP expanded at a 1.4% annualized pace in the fourth quarter of 2025, down from 4.4% in the third quarter.
Much of this slowdown reflected the effects of the fall government shutdown, which reduced federal spending and disrupted some economic activity. Underlying private sector demand remained relatively resilient. Consumer spending increased 2.4% and business investment rose 3.7%, supported in part by continued investment in artificial intelligence and advanced technologies.
Inflation data during February delivered mixed signals. The January Consumer Price Index showed headline inflation rising 2.4% year over year, down from 2.7% in December and marking the lowest reading in several months. Core inflation also moderated, suggesting continued progress toward price stability.
However, the Producer Price Index released later in the month surprised to the upside, driven largely by service-sector costs. This raised concerns that some underlying inflation pressures may remain persistent.
The Federal Reserve maintained its policy rate in the 3.50% to 3.75% range. Minutes from the January Federal Open Market Committee meeting revealed a somewhat divided outlook among policymakers. Some members indicated they could support rate cuts later in the year if inflation continues to ease, while others expressed caution given the possibility of renewed price pressures.
Markets currently expect the first potential rate cut to occur sometime in the middle of 2026, though that outlook remains highly dependent on upcoming inflation data.
Corporate Earnings, Consumers, and the Real Economy
Fourth quarter earnings season progressed steadily through February, with approximately three-quarters of S&P 500 companies reporting results that exceeded expectations. The blended year-over-year earnings growth rate stands near 13%, marking the fifth consecutive quarter of double-digit earnings growth.
Technology, industrials, and communication services have led earnings growth, while consumer discretionary and energy companies have shown more mixed results. The forward price-to-earnings ratio for the S&P 500 remains elevated relative to historical averages, suggesting that continued earnings growth will be important for sustaining current valuations.
Consumer sentiment improved modestly during the month. The University of Michigan Consumer Sentiment Index rose to 56.6, the highest reading since August 2025. Despite the improvement, sentiment remains well below long-term averages as elevated prices continue to weigh on household finances.
Consumer spending continued to support economic growth in the fourth quarter, with personal consumption rising 2.4 % in the GDP report. Higher-income households have continued to drive spending on services such as travel and dining, while purchases of durable goods have softened somewhat as borrowing costs remain elevated.
Manufacturing data presented a mixed but cautiously improving picture. Industrial production rose 0.7 % month over month, signaling continued resilience in factory output. Meanwhile, the services sector remained a bright spot, with the ISM Services PMI holding steady at 53.8 and marking nineteen consecutive months of expansion.
Labor market indicators suggested a gradual cooling in demand. Job openings declined to their lowest level in several years and weekly jobless claims edged higher. Even so, the overall employment environment remains far from recessionary.
Geopolitical Risk Becomes the Market’s Main Near-Term Driver
By early March, the dominant force shaping markets was no longer just inflation, earnings, or Federal Reserve policy. It was the escalating conflict involving the United States, Israel, and Iran, along with the growing risk of disruption across the broader Middle East. For investors, the clearest transmission mechanism has been energy. Oil prices surged into the first week of March as markets began pricing in the possibility of supply interruptions, particularly around the Strait of Hormuz and other critical regional infrastructure. Reuters reported that Brent and WTI briefly moved above $119 a barrel, their highest levels since 2022, as traders reacted to fears of halted shipping, reduced production, and a broader regional supply shock.
Historically, markets often react to war in two phases. The first phase is immediate and emotional: oil rises, volatility increases, and investors move toward assets perceived as defensive or more resilient. The second phase depends on whether the conflict creates a lasting economic shock. J.P. Morgan notes that most geopolitical events have not had a lasting impact on large-cap equity returns unless they lead to something bigger, such as a sustained supply disruption or broader recessionary pressure. In other words, markets often recover from the initial headline shock, but conflicts that materially affect inflation, energy supply, trade routes, or economic growth can have more durable consequences.
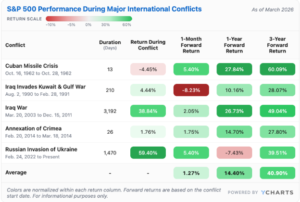
That distinction matters right now. The war itself is unsettling, but what markets appear to be focusing on most is whether it remains a contained geopolitical event or becomes an economic event. If oil stabilizes and supply channels remain functional, history suggests markets may eventually look through the conflict. But if the war leads to prolonged disruption in energy production, shipping, or inflation expectations, the impact could be broader and more persistent. That is why this moment calls for perspective. Geopolitical shocks can create sharp short-term volatility, but long-term market outcomes are usually driven less by the headlines themselves and more by whether those headlines change the underlying economic picture.
Final Thoughts
February served as a reminder that markets rarely move in straight lines. After a strong 2025 and a solid start to the year in January, some consolidation and sector rotation were not unexpected.
The broader economic backdrop remains constructive. Growth continues, inflation is moderating, corporate earnings are strong, and consumers are still spending. At the same time, investors are navigating a more complex environment that includes elevated valuations, shifting monetary policy expectations, and escalating geopolitical tensions.
For long-term investors, the core principles remain unchanged. Maintain diversification, stay disciplined, and focus on long-term goals rather than short-term market movements.
Periods of uncertainty can feel uncomfortable, but they are also a normal part of the market cycle. Patience and perspective remain two of the most valuable tools investors have.
Data Sources:
Bureau of Economic Analysis (BEA): GDP Advance Estimate, Q4 2025. Bureau of Labor Statistics (BLS): Consumer Price Index, January 2026; Producer Price Index, January 2026. MSCI Inc.: MSCI EAFE, MSCI Emerging Markets, MSCI World ex-U.S. Index data. S&P Dow Jones Indices: S&P 500, Dow Jones Industrial Average index data. FTSE Russell: Russell 2000 index data. NASDAQ: Composite index data. University of Michigan: Surveys of Consumers, February 2026 (Final). Federal Reserve: FOMC Minutes, January 2026 Meeting. Institute for Supply Management (ISM): Services PMI. EPFR Global: Fund flow data. Charles Schwab: Sector and market commentary. LPL Financial: Emerging markets and sector research. Bloomberg, CNBC, Yahoo Finance: Market data and reporting. JP Morgan Private Bank. Reuters. YCharts.